 Smart Chart Hub
Support Levels, Explained Without the Jargon
Why price keeps "bouncing" off the same spot, and why that tells you where to look, not what will happen.

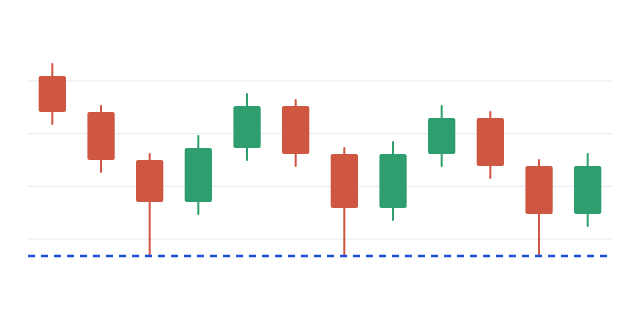
Open almost any chart and you’ll notice something odd. Price drops, stops at a certain spot, and bounces. Then it does it again. And sometimes a third time.
That spot has a name: support. It’s one of the first things I teach, because it changes how you look at every chart.
What support actually is
Support is simply a price area where buyers have stepped in before. Every time price falls to it, enough people decide “this is cheap enough” that the drop pauses.
There’s no magic line. It’s a zone, a memory the market keeps. The more times price reacts there, the more people notice it, and the more it matters.
The mistake beginners make
Beginners read only the last candle. Red candle? “It’s going down.” Green candle? “It’s going up.”
A trained eye reads the whole story first. Where has price reacted before? Where are we now relative to that? That single habit filters out a huge number of impulsive decisions.
What support does not do
Here’s the honest part: support doesn’t predict anything. A level that held three times can break on the fourth. That happens all the time.
What support gives you is context. It tells you where to pay attention and where a plan makes sense, including a plan for being wrong.
Support doesn’t tell you what will happen. It tells you where to look.
How to practice it in 10 minutes
- Open any chart and zoom out until you see several ups and downs.
- Find a price area where the drop paused at least twice. Mark it.
- Scroll forward and watch what happened the next time price came back. No judging, just observing.
- Repeat on five different charts. Your eye will start spotting levels before you consciously look for them.
That’s how a trained eye is built: not by guessing in real time, but by reviewing real examples again and again.
Educational content only. Not investment advice. Trading involves risk, and you can lose money.
Want to practice this with a mentor? Take the 60-second test, or book a free 1-on-1 consultation and we’ll build your personal 5-step starter plan.
Take the test → Free consultationGet your free 5-step starter plan
A free 1-on-1 consultation where we build your plan together, plus a risk management checklist. No experience needed.